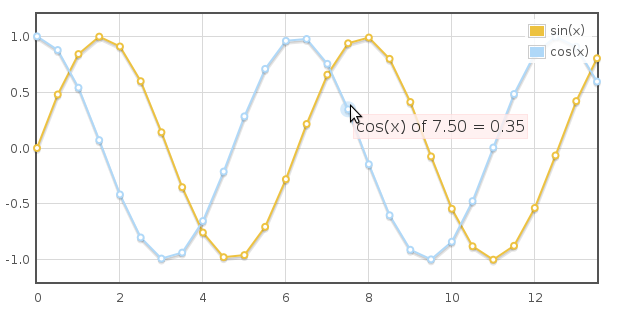
Problem: You want to render data that’s contained in a Javascript associative array on the client.
Solution: Use jQuery and Flot, a jQuery charting plug-in.
jQuery is a Javascript library that makes writing client-side code extremely easy and quick through a “shorthand” syntax that is geared toward accessing page DOM elements and actions. Flot is, according to its developers, an “attractive Javascript plotting library for jQuery”. Looking over their gallery of samples, I’d have to agree:

1) Obtain jQuery from the jquery.com site and reference into your page:
<
scripttype="text/javascript"src="/Scripts/jquery-1.3.2.min.js"mce_src="/Scripts/jquery-1.3.2.min.js"></script>2) Obtain Flot from its Google Source repository: http://code.google.com/p/flot/ and reference into your page.
There’s a lot of files in there, but the ones you will want to use are jquery.flot.min.js and excanvas.min.js. Reference these libraries into your page (after copying them into your Scripts folder) as follows:
<
scripttype="text/javascript"src="/Scripts/jquery.flot.min.js"mce_src="/Scripts/jquery.flot.min.js"></script><!--[if IE]><script language="javascript" type="text/javascript" src="/Scripts/excanvas.min.js"></script><![endif]-->
Note that the excanvas.min.js library is needed for IE browsers to render the chart because it lacks a native “canvas” object.
3) Add a <DIV> element to the page that will host your chart:
<divid="chartPlaceholder"style="width:600px; height:300px”></div>
Note that the id of the DIV element will be referenced by the Flot code, so name it appropriately to keep your code readable and maintainable.
4) Build an associative array in Javascript to contain your data, eg:
var
_dataArray = new Array();Populate the array accordingly.
5) Create a method to build a Flot bar chart from your associative array data:
function plotMyChart()
{
$.plot($("#chartPlaceholder"), [
{
data: _dataArray,
bars: { show: true },
color: "rgb(131,176,236)"
}],
{
xaxis: {
ticks: [[0.5, "Q3"], [1.5, "Q6"], [2.5, "Q9"], [3.5, "Q12"],
[4.5, "Q15"], [5.5, "Q18"], [6.5, "Q21"], [7.5, "Q24"],
[8.5, "Q27"], [9.5, "Q30"], [10.5, "Q33"], [11.5, "Q36"],
[12.5, "Q39"], [13.5, "Q42"], [14.5, "Q45"], [15.5, "Q47"]]
},
yaxis: {
tickSize: 5
}
}
);
}
6) Behold your new chart:
